
Alberta Grade 8 Full Year Bundle - Math - GOOGLE AND PDF
Alberta Grade 8 Full Year Bundle - Math - GOOGLE AND PDF
Regular price
$40.00 CAD
Regular price
Price
$54.00 CAD
Sale price
$40.00 CAD
Save $14.00 CAD
Unit price
per
Interested in a bundle? Shop below instead!
Couldn't load pickup availability
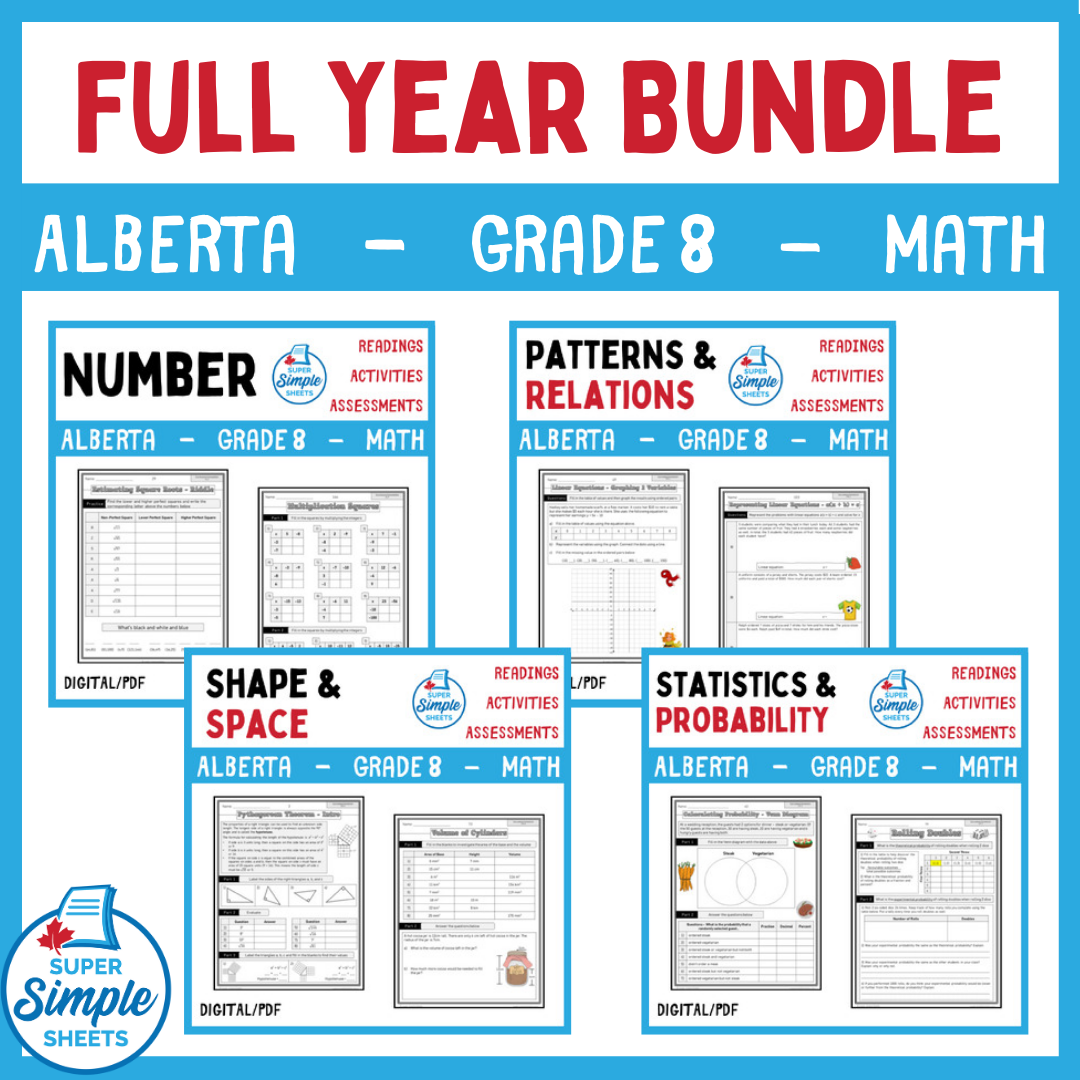
Grade 8 – Alberta Math Curriculum. This resource covers all expectations in the Grade 8 – Alberta Math Curriculum.
Teaching made easy! GOOGLE CLASSROOM VERSION - PDF INCLUDED! This gives you the ability to print worksheets as well as distribute a digital copy of the resource to your students on Google Classroom.
Number-
Concepts that are covered:
- Review of multiplication and division
- Perfect squares and square roots
- Estimating square roots of numbers that are not perfect squares
- Visuals of square roots/perfect squares – area and number lines
- Converting fractions, decimal numbers, and percents
- Understanding percents greater than 100
- Rate and ratio
- Equivalent rates
- Identifying proportional and non-proportional relationships in various situations.
- Determining the value of a missing value in a ratio
- Converting mixed numbers and improper fractions
- Simplifying fractions
- Adding, subtracting, multiplying and dividing fractions using models and rules
- Adding and subtracting integers using numerous strategies – zero pairs, models
- Multiplying and dividing integers using rules and area models
- Multiplying fractions using repeated addition and number lines
- Word problems for all basic concepts for students to apply their understanding
- 4 Unit Tests
Patterns and Relations-
Some of the concepts that are covered:
- Determining pattern rules to extend patterns
- Basics of linear relationships (two-variable relations)
- Identifying linear relationships displayed as graphs and in tables of values
- Creating tables of values that represent patterns
- Creating graphs from tables of values
- Determining linear equations that represent patterns
- representing linear equations using ordered pairs
- Graphing ordered pairs to display linear equations
- Determining the missing values in ordered pairs based on linear equations and pictorial patterns
- Solving problems arising in real-life situations using linear equations
- Using models to solve problems in the form of: ax = b, x/a = b, ax + b = c, x/a + b = c, a(x + b) = c
- Representing real-life situation as linear equations in the form of: ax = b, x/a = b, ax + b = c, x/a + b = c, a(x + b) = c
- 3 Unit Tests – 1 for each strand: Patterns, Equations, and Coding
Shape and Space-
Some of the concepts that are covered:
- Use the Pythagorean theorem to determine if a triangle is a right triangle
- Use the Pythagorean theorem to calculate the length of a side on a right triangle
- Draw 3D objects using nets
- Construct nets that represent 3D objects
- Represent 3D objects by drawing them as nets on a grid
- Determine the surface area of rectangular prisms, triangular prisms and cylinders
- Use nets to calculate the surface area of 3D objects
- Calculate the area of circles and semi-circles
- Calculate the volume of rectangular prisms, triangular prisms, and cylinders
- Use the area of the base of 3D objects to calculate volume
- Drawing top, front, and side views of objects
- Draw objects using top, front, and side views of objects
- Create 3D objects using top, front, and side views
- Understanding of congruency of polygons
- Use of mapping rules to determine new coordinates after a transformation – translations, rotations, and reflections
- Translations, reflections, and rotations of up to 360 degrees on a cartesian plane
- Performing multiple transformations of 2D shapes on a cartesian plane
Statistics and Probability-
Some of the concepts that are covered:
- Comparing different types of graphs that display the same data to identify the strengths and weaknesses of different types of graphs
- Identifying the advantages and disadvantages of different types of graphs (bar graphs, circle graphs, pictographs, line graphs and double-bar graphs)
- Interpreting bar graphs, broken-line graphs, multiple-bar graphs, circles graphs and pictographs
- Creating a variety of graphs, including circle graphs and multiple-bar graphs
- Determining the mean, median, and mode of data sets
- Determining the impact of adding or removing outliers from a data set on the mean, median, and mode
- Finding the missing value in a data set using the mean
- Drawing conclusions about different sets of data
- Thinking critically about misleading graphs (bar graphs, circle graphs, pictographs, line graphs and double-bar graphs)
- Creating misleading graphs by using different scales and line breaks
- Using fractions, decimals, and percents to represent the probability of multiple independent events
- Understanding the difference between theoretical and experimental probability
- Comparing theoretical and experimental probabilities of independent events
- Using tree diagrams to represent independent events
- Use Venn diagrams to represent probabilities and help solve probability problems
***Answer Pages for all worksheets are included