Grade 6 - Manitoba Math - Full Year Bundle
Grade 6 - Manitoba Math - Full Year Bundle
Regular price
$33.00 CAD
Regular price
Price
$44.00 CAD
Sale price
$33.00 CAD
Save $11.00 CAD
Unit price
per
Interested in a bundle? Shop below instead!
Couldn't load pickup availability
PRODUCT PREVIEW
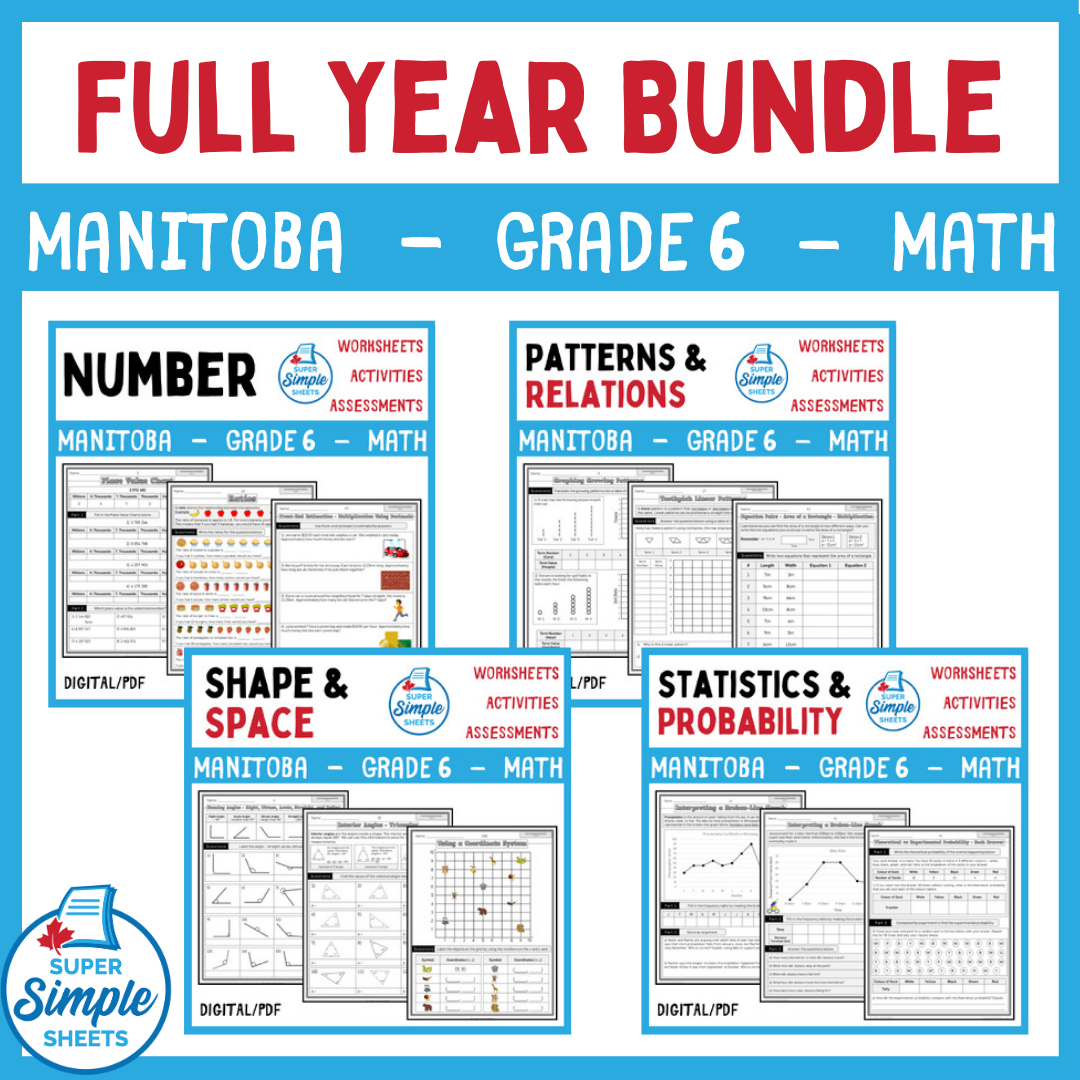
DIGITAL AND PDF INCLUDED! Grade 6 - Manitoba Math Curriculum Updated 2013 – This resource covers all expectations in the Grade 6 – Manitoba Math Curriculum. This product contains 865 activity sheets.
Check out each of the strands below to learn more about the resources included in this bundle.
Strand 1 - Number (Number Sense)
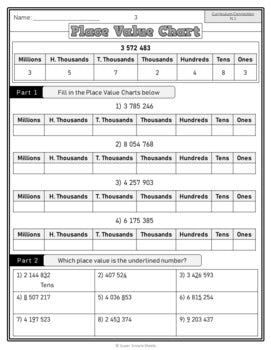
- Composing and decomposing whole numbers greater than one million
- Understanding place value with whole numbers greater than one million
- Working with large numbers (billions and trillions) using technology
- Read and represent integers using horizontal and vertical number lines
- Comparing integers, decimal numbers, and fractions
- Read, represent, compare, and order decimal numbers greater than thousands
- Round decimal numbers – both terminating and repeating as well as front-end estimation
- Relate improper fractions to mixed numbers and mixed numbers to improper fractions
- Composite and prime numbers using factor trees
- Multiplying and dividing whole numbers by decimal numbers
- Rates and ratios
- Understand percentages and relate to decimals and fractions
- 5 Unit Tests – (Place Value), (Adding/Subtracting), (Multiplying/Dividing), (Factors, Fractions, and Ratios), (Integers, Decimals, Fractions, and Percents)
Strand 2 - Patterns and Relations
- Extending growing and shrinking patterns
- Translating growing and shrinking patterns using tables of values and graphs
- Increasing/Decreasing patterns using all 4 operations (addition, subtraction, multiplication and division)
- Determining pattern rules and pattern cores
- Representing patterns in table of values
- Analyzing tables looking for patterns to help solve problems
- Linear patterns – analyzing patterns in graphs
- Creating and describing patterns using whole numbers and decimal to the hundredths
- Graphing table of values
- Investigating decimals patterns using number strings
- Solving equations using variables
- Solving patterns using algebraic expressions and equations
- Representing patterns using simple algebraic expressions and equations
- Balancing equations using all 4 operations
- Evaluating algebraic expressions
- Understanding the meaning of preservation of equality using pictures and concretely
- 2 Unit Tests – 1 for each strand
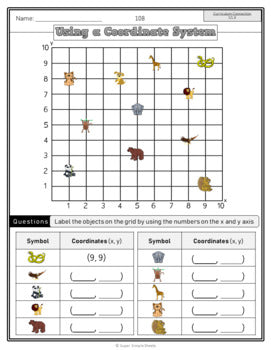
Strand 3 - Shape and Space (3-D Objects and 2-D Shapes)
- Identifying angles as acute, obtuse, right, straight, and reflex
- Drawing acute, obtuse, right, straight, and reflex angles
- Estimate the size of angles up to 360 degrees
- Reading a protractor
- Using a protractor to determine angle size of up to 360 degrees
- Constructing angles up to 360 degrees
- Using Interior and exterior angles to determine unknown angles in triangles and quadrilaterals
- Difference between polygons and non-polygons as well as regular and irregular polygons
- Find the perimeter of polygons using different formulas
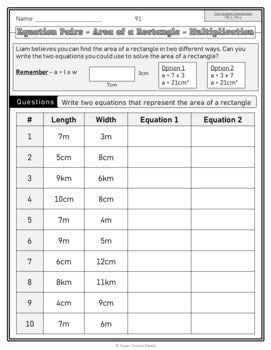
- Find the area of rectangles using different formulas
- Find the volume of rectangular prisms using different formulas
- Identifying and drawing scalene, isosceles, and equilateral triangles
- Identifying and drawing right, obtuse, and acute triangles
- Identify transformations – translations, rotations, and reflections
- Perform transformations – translations, rotations, and reflections
- Create designs using multiple transformations
Strand 4 - Statistics and Probability
- Difference between discrete and continuous data
- Difference between qualitative and quantitative data
- Difference between primary and secondary data
- Understanding the importance of random sampling
- Investigating the different random sampling techniques
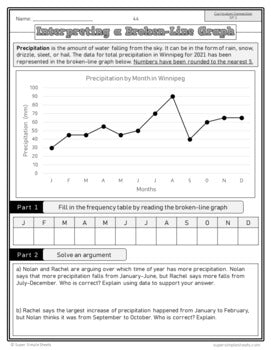
- Interpreting bar graphs, multiple-bar graphs, and broken-line graph
- Creating pictographs, bar graphs, multiple-bar graphs, broken-line graphs, and multiple broken-line graphs.
- Creating an appropriate scale for a graph as well as labels
- Creating and interpreting infographics
- Drawing conclusions about different sets of data
- Thinking critically about misleading graphs
- Creating misleading graphs
- Using a probability line to decide the probability of an event
- Using fractions, decimals, and percent to represent the probability of an event
- Understanding the difference between theoretical and experimental probability
- Performing experimental probability of two independent events
- Determining the theoretical probability of two independent events using tree diagrams
This is a comprehensive unit that will save you hours of planning! It has been tested and found effective in helping students achieve the specific learning outcomes created by Manitoba Education.