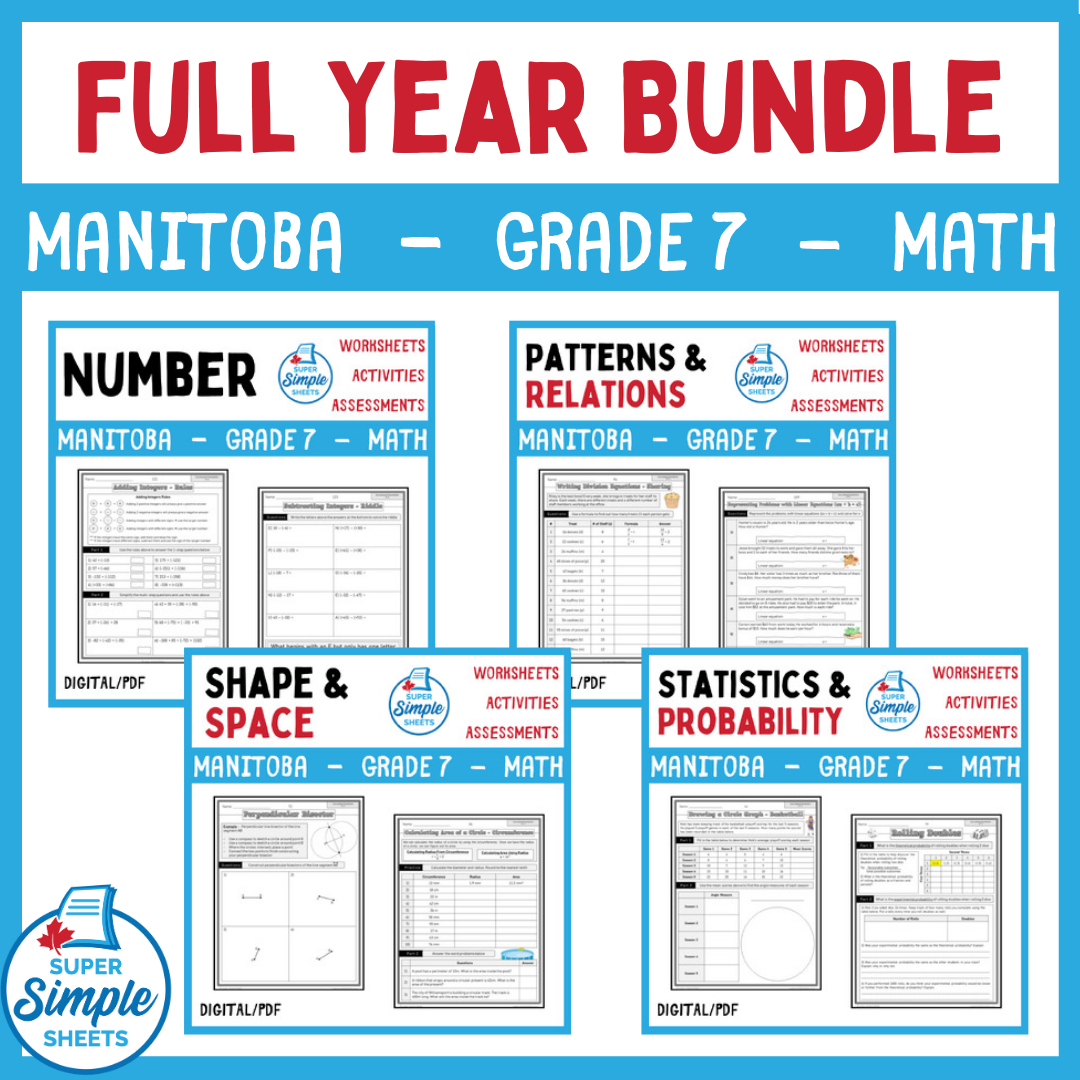
Manitoba Grade 7 Full Year Bundle - Math - GOOGLE AND PDF
Manitoba Grade 7 Full Year Bundle - Math - GOOGLE AND PDF
Regular price
$40.00 CAD
Regular price
Price
$54.00 CAD
Sale price
$40.00 CAD
Save $14.00 CAD
Unit price
per
Interested in a bundle? Shop below instead!
Couldn't load pickup availability
GOOGLE CLASSROOM VERSION - PDF INCLUDED! This gives you the ability to print worksheets as well as distribute a digital copy of the resource to your students on Google Classroom.
Grade 7 – Manitoba Math Curriculum – Number. This resource covers all outcomes in the Grade 7 – Manitoba Math Curriculum - Strand: Number.
Number-
Concepts that are covered:
- Divisibility rules (2, 3, 4, 5, 6, 8, 9, and 10) as well as why a number cannot be divided by 0
- Addition and subtraction of decimal numbers (to the thousandths place value)
- Multiplication and division of decimal numbers using 1-digit divisors and 2-digit multipliers
- Finding the missing percents in word problems (0% - 100%)
- Converting fractions, decimals and percents
- Determining the value of percents from 1% - 100%
- Identifying terminating and repeating decimals
- Patterns found in repeating decimals
- Adding and subtracting fractions and mixed numbers with like and unlike denominators
- Converting improper fractions to mixed numbers and vise versa
- Adding and subtracting integers using zero pairs and number lines
- Using addition and subtracting integer rules to solve equations
- Comparing and ordering fractions, decimals, and whole numbers
- Determining equivalent fractions
- Simplifying fractions
- Determining fractions on a number line
- 3 Unit Tests
Patterns and Relations-
Some of the concepts that are covered:
- Increasing/Decreasing patterns using all 4 operations (addition, subtraction, multiplication and division)
- Determining pattern rules to extend patterns
- Finding linear relations in our everyday lives
- Representing patterns in table of values
- Recursive and functional patterns
- Constant rates and initial values
- Translating linear relations into tables of values and graphs
- Finding term number “n” in a pattern using the linear relation
- Analyzing tables of values and graphs to draw conclusions and solve problems
- Representing patterns using algebraic expressions to help solve for any term in a pattern
- Linear patterns – analyzing patterns in graphs
- Positive and negative integers in patterns
- Using pictures and symbols to model preservation of equality
- Solving equations to find the missing values
- Representing real-world situations as equations
- Explaining the different between expressions and equations
- Evaluating expressions when given the value of a variable
- Use one-step linear equations of the form x + a = b to represent real-world situations
- Use linear equations of the form ax = b, ax + b = c, and x/a = b to represent real-world situations
Shape and Space-
Some of the concepts that are covered:
- Radius, diameter, and circumference of circles
- Relating circumference to pi
- Constructing circles with a given radius or diameter
- Solving word problems involving radii, diameters, and circumferences of circles
- Determining the area of triangles, parallelograms, and circles
- Calculating the area of compound shapes made up of triangles, parallelograms and rectangles.
- Determining the area of semi-circles
- Rays, lines, line segments and points
- Constructing perpendicular line segments and perpendicular bisectors using graph paper, a protractor, and a compass
- Constructing parallel line segments using graph paper, a protractor, and a compass
- Constructing angle bisectors using a compass
- Labeling each of the four quadrants on a cartesian plane
- Identify and plot points in the four quadrants of a cartesian plane
- Translations, reflections, and rotations of up to 360 degrees on a cartesian plane
Statistics and Probability-
Some of the concepts that are covered:
- Determining the mean, median, mode, and range of multiple data sets
- Finding the missing data point in a data set using the mean
- Determining outliers in a data set and explaining what outliers could represent
- Determining the effect of outliers in data sets on the mean, median and mode
- Understanding when to use each measure of central tendency to report findings
- Difference between primary and secondary data
- Interpreting bar graphs, broken-line graphs, multiple-bar graphs, and circles graphs
- Creating bar graphs, broken-line graphs, and circle graphs
- Creating an appropriate scale for a variety of graphs as well as labels
- Creating and interpreting infographics
- Drawing conclusions about different sets of data
- Thinking critically about misleading graphs
- Using fractions, ratios, and percents to represent the probability of multiple events
- Understanding the difference between theoretical and experimental probability
- Identifying the sample space (number of total outcomes) for experiments involving two independent events
- Comparing theoretical and experimental probabilities of independent and dependent events
- Using tree diagrams to represent independent events
***Answer Pages for all worksheets are included