Grade 7 - Data Literacy and Probability - Ontario Math - Lesson/Workbook Bundle
Grade 7 - Data Literacy and Probability - Ontario Math - Lesson/Workbook Bundle
Interested in a bundle? Shop below instead!
Couldn't load pickup availability
Description
Grade 7 - Data Literacy and Probability Unit - Lesson/Workbook Bundle - Ontario Math Curriculum. This bundle was created to provide everything you need to teach the Grade 7 Data Literacy and Probability unit in the Ontario Math Curriculum.
With your purchase, you will receive lesson slides that follow the 3-Part lesson format, engaging your students from start to finish. You will also receive the workbook, which contains fun activities and worksheets for your students to demonstrate their understanding.
Workbook Details:
This resource covers all expectations in the Grade 7 - Ontario Math Curriculum - Strand: Data (D1: Data Literacy and D2: Probability).
There are 265 activity sheets for your students to learn and practice the specific expectations in the curriculum. Using this resource will ensure that your students will be learning the Ontario curriculum.
In addition to our comprehensive worksheets, we have added hands-on activities to make this best-selling resource even more engaging.
Some of the concepts that are covered:
- Why we use percentages to represent a variable for a population
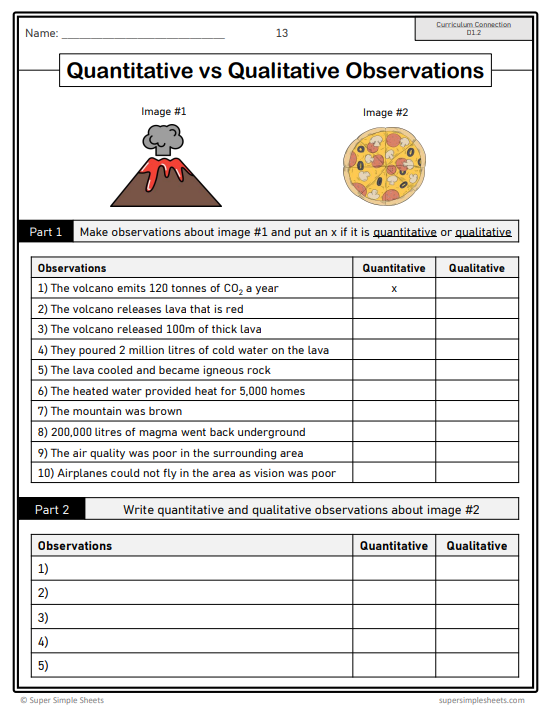
- Difference between qualitative and quantitative data
- Difference between primary and secondary data
- Understanding the importance of random sampling
- Interpreting bar graphs, broken-line graphs, multiple-bar graphs, and circles graphs
- Creating bar graphs, broken-line graphs, and circle graphs
- Determining the mean, median, and mode of data sets
- Determining the impact of adding or removing data from a data set on the mean, median, and mode
- Finding the missing value in a data set using the mean
- Determining outliers in a data set and explaining what outliers could represent
- Creating an appropriate scale for a variety of graphs as well as labels
- Creating and interpreting infographics
- Drawing conclusions about different sets of data
- Thinking critically about misleading graphs
- Creating misleading graphs
- Using fractions, decimals, and percents to represent the probability of multiple events
- Understanding the difference between theoretical and experimental probability
- Understanding the difference between dependent and independent events
- Comparing theoretical and experimental probabilities of independent and dependent events
- Using tree diagrams to represent independent and dependent events
- Hands-on Activities: Task Cards: Mean Detective, Research Activity: Graph Hunter, Flip the Data, Truth or Lie? Graph Edition.
- Exit Cards x 11
- 2 Unit Tests
After purchasing this resource, you will be able to download a copy of this file to your Google Drive. From there, you can complete these lessons with your class, and/or assign these slides in Google Classroom.