
Grade 8 - Alberta Math - Lessons/Workbook Mega Bundle
Grade 8 - Alberta Math - Lessons/Workbook Mega Bundle
Interested in a bundle? Shop below instead!
Couldn't load pickup availability
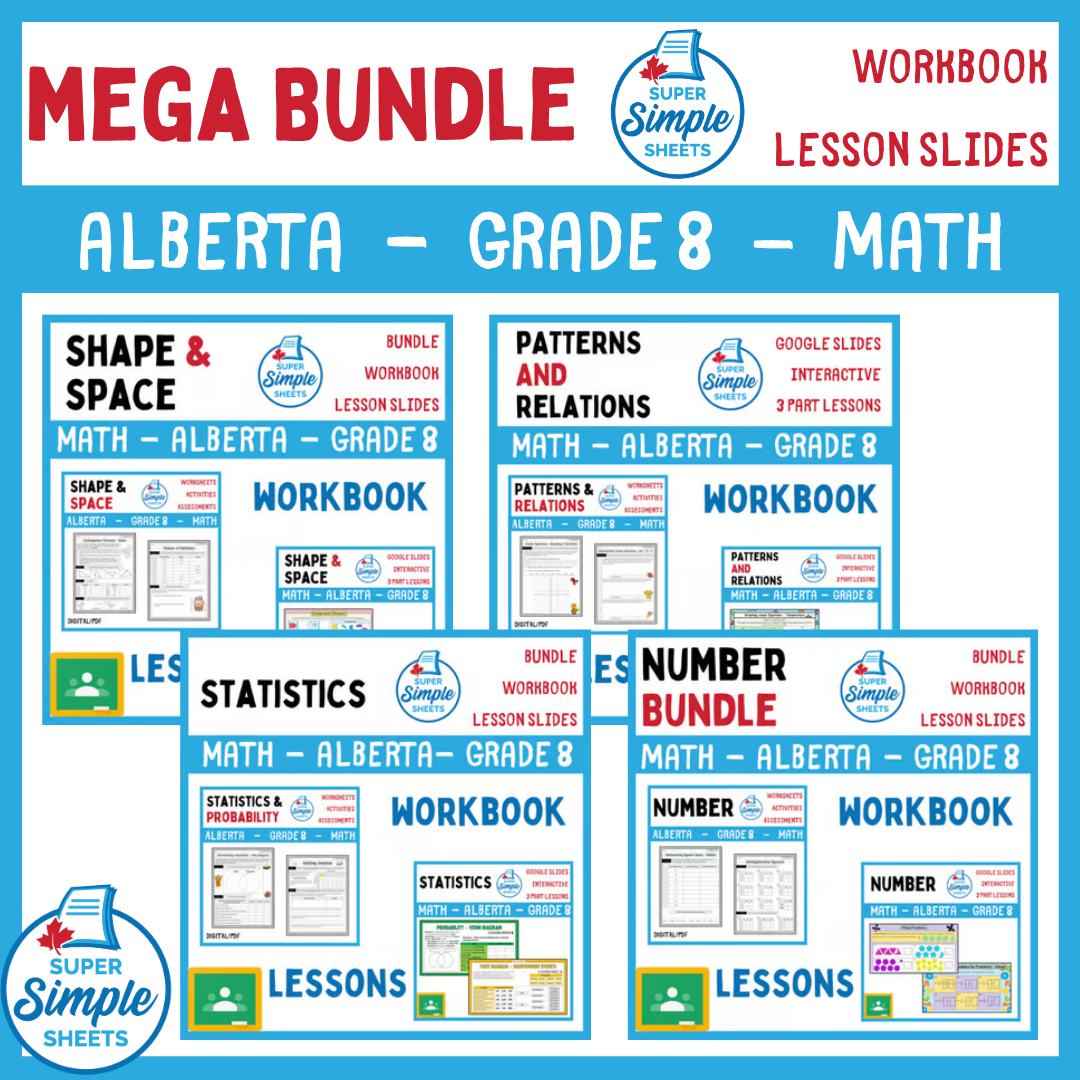
This mega bundle provides everything you need to teach all the units in the Grade 8 Alberta Math Curriculum.
With your purchase, you will receive lesson slides that follow the 3-Part lesson format, engaging your students from start to finish. You will also receive the workbooks, which contain fun activities and worksheets for your students to demonstrate their understanding.
Shape and Space Unit
Workbook
Some of the concepts that are covered:
- Use the Pythagorean theorem to determine if a triangle is a right triangle
- Use the Pythagorean theorem to calculate the length of a side on a right triangle
- Draw 3D objects using nets
- Construct nets that represent 3D objects
- Represent 3D objects by drawing them as nets on a grid
- Determine the surface area of rectangular prisms, triangular prisms and cylinders
- Use nets to calculate the surface area of 3D objects
- Calculate the area of circles and semi-circles
- Calculate the volume of rectangular prisms, triangular prisms, and cylinders
- Use the area of the base of 3D objects to calculate volume
- Drawing top, front, and side views of objects
- Draw objects using top, front, and side views of objects
- Create 3D objects using top, front, and side views
- Understanding of congruency of polygons
- Use of mapping rules to determine new coordinates after a transformation – translations, rotations, and reflections
- Translations, reflections, and rotations of up to 360 degrees on a cartesian plane
- Performing multiple transformations of 2D shapes on a cartesian plane
- Hands-on Activities: Math Tic-Tac-Toe: Pythagorean Challenge, Math Race: Circumference, Radius, Diameter, and Area, Circle Area Discovery, Scavenger Hunt: Volume of Rectangular Prisms, Cylinder Volume Toss Challenge, 3D Shape Exploration, Translation Toss Challenge, Spin and Draw: Rotating Shapes, Transformation Battleship.
- Exit Cards x 11
- Unit Test 3
Number Unit
Workbook
Some of the concepts that are covered:
- Review of multiplication and division
- Perfect squares and square roots
- Estimating square roots of numbers that are not perfect squares
- Visuals of square roots/perfect squares – area and number lines
- Converting fractions, decimal numbers, and percents
- Understanding percents greater than 100
- Rate and ratio
- Equivalent rates
- Identifying proportional and non-proportional relationships in various situations.
- Determining the value of a missing value in a ratio
- Converting mixed numbers and improper fractions
- Simplifying fractions
- Adding, subtracting, multiplying and dividing fractions using models and rules
- Adding and subtracting integers using numerous strategies – zero pairs, models
- Multiplying and dividing integers using rules and area models
- Multiplying fractions using repeated addition and number lines
- Word problems for all basic concepts for students to apply their understanding
- Answer pages for all activity sheets!
- Hands-on Activities: Multiplication Bottle Flip Challenge, Square Root Hopscotch, Task Cards: Square Root Operations, Fraction/Decimal/Percent Bottle Flip Challenge, Memory Game: Matching Equivalent Rates, Math Hot Seat: Addition Challenge, Multiplication Race, Quiz Creator Competition: Fraction Division Challenge, Math Jeopardy – Integer Operations.
- Exit Cards x 15
- 4 Unit Tests
Algebra - Patterns and Time Unit
Workbook
Some of the concepts that are covered:
- Determining pattern rules to extend patterns
- Basics of linear relationships (two-variable relations)
- Identifying linear relationships displayed as graphs and in tables of values
- Creating tables of values that represent patterns
- Creating graphs from tables of values
- Determining linear equations that represent patterns
- representing linear equations using ordered pairs
- Graphing ordered pairs to display linear equations
- Determining the missing values in ordered pairs based on linear equations and pictorial patterns
- Solving problems arising in real-life situations using linear equations
- Using models to solve problems in the form of: ax = b, x/a = b, ax + b = c, x/a + b = c, a(x + b) = c
- Representing real-life situation as linear equations in the form of: ax = b, x/a = b, ax + b = c, x/a + b = c, a(x + b) = c
- 3 Unit Tests – 1 for each strand: Patterns, Equations, and Coding
- 13 Exit Cards
- Hands-On Activities: Algebra Jeopardy, Algebraic Adventure Hunt, Task Cards: Patterning – All Operations, Finger Signals Quiz - Understanding Algebraic Expressions, Matching Game: Do The Equations Match?, Math Tic-Tac-Toe: Balance The Equations, Decimal Multiplication Race, Math Hot Seat: Evaluating Equations, Math Basketball: Linear Equations Challenge, Algebraic Bottle Flip Challenge.
- Answer pages
Statistics Unit
Workbook
Some of the concepts that are covered:
- Comparing different types of graphs that display the same data to identify the strengths and weaknesses of different types of graphs
- Identifying the advantages and disadvantages of different types of graphs (bar graphs, circle graphs, pictographs, line graphs and double-bar graphs)
- Interpreting bar graphs, broken-line graphs, multiple-bar graphs, circles graphs and pictographs
- Creating a variety of graphs, including circle graphs and multiple-bar graphs
- Determining the mean, median, and mode of data sets
- Determining the impact of adding or removing outliers from a data set on the mean, median, and mode
- Finding the missing value in a data set using the mean
- Drawing conclusions about different sets of data
- Thinking critically about misleading graphs (bar graphs, circle graphs, pictographs, line graphs and double-bar graphs)
- Creating misleading graphs by using different scales and line breaks
- Using fractions, decimals, and percents to represent the probability of multiple independent events
- Understanding the difference between theoretical and experimental probability
- Comparing theoretical and experimental probabilities of independent events
- Using tree diagrams to represent independent events
- Use Venn diagrams to represent probabilities and help solve probability problems
- Hands-on Activities: Task Cards: Mean Detective, Research Activity: Graph Hunter, Flip the Data, Truth or Lie? Graph Edition, Math Hot Seat: Probability Showdown.
- Exit Cards x 10
- 2 Unit Tests
Google Lesson Slides
Grade 8 - Google Lesson Slides - Alberta Math Curriculum. This resource is packed with all the lessons you need to teach the Grade 8, Alberta Math Curriculum.
We have structured these lessons to follow the popular 3-Part Lesson format. By using these lessons, you will be provided with learning goals, discussion questions, relevant YouTube videos, interactive slides, exit cards, and more. Check out the variety of activities you'll receive below.
Part 1: Minds On!
- Learning Goals
- Discussion Questions
- Polls/Surveys
- Picture Prompts
- Jokes and Riddles
- Relevant Quotes
Part 2: Action!
- Interactive Activities
- Drag and Drop
- Fill in the Blanks
- Matching
- Sorting
- Polls/Surveys and Graphing
- Embedded YouTube Videos
Part 3: Consolidation
- Exit Cards
- 3-2-1 Reflections
- One Word Reflections
- Act It Out!
- Quick Draw
- One Sentence Summary
After purchasing this resource, you will be able to download copies of the Google Slides for the three different units to your Google Drive. From there, you can complete these lessons with your class, and/or assign these slides in Google Classroom.