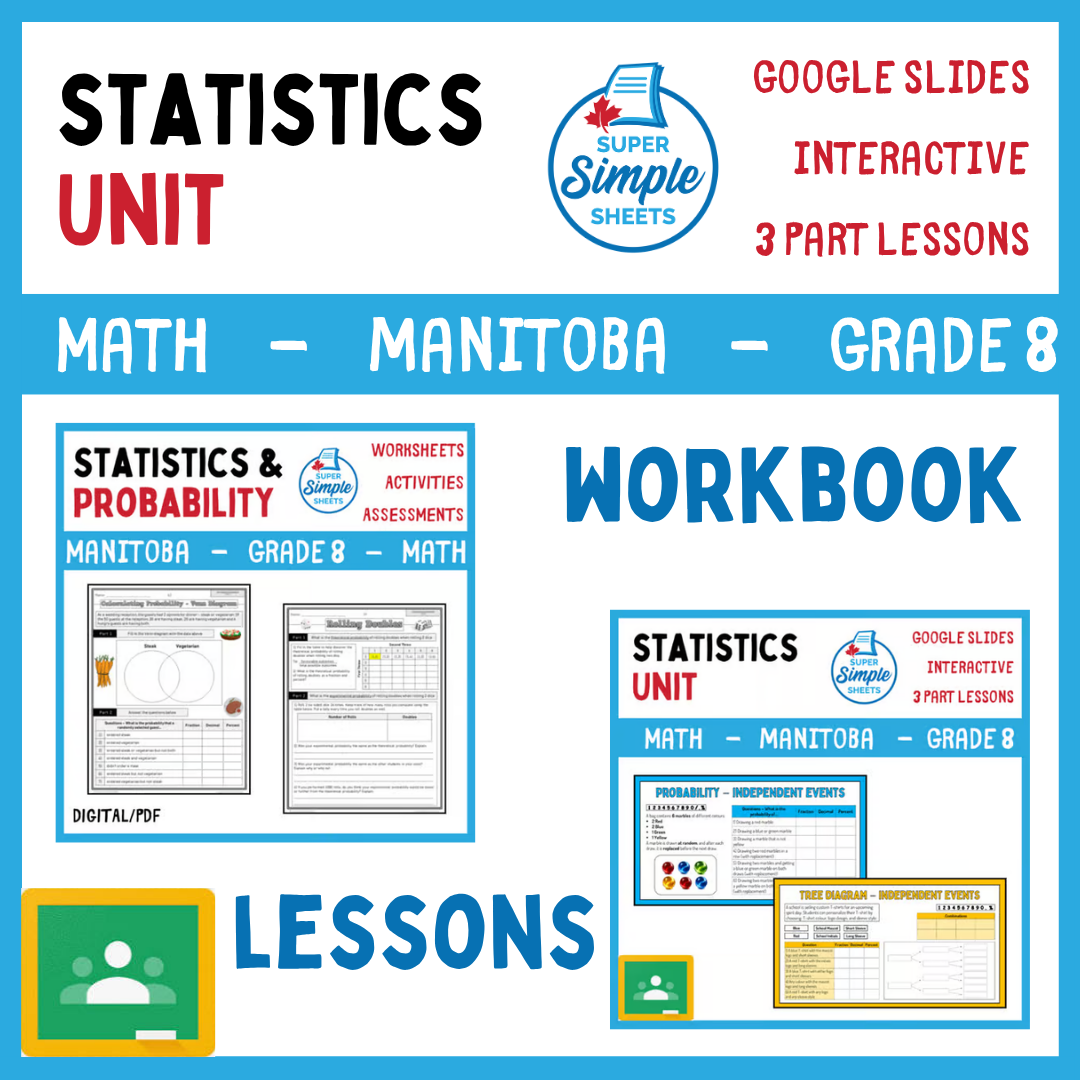

Grade 8 - Statistics Unit - Manitoba Math - Lesson/Workbook Bundle
Grade 8 - Statistics Unit - Manitoba Math - Lesson/Workbook Bundle
Interested in a bundle? Shop below instead!
Couldn't load pickup availability
Grade 8 - Statistics Unit - Manitoba Math - Lesson/Workbook Bundle! This resource covers all outcomes in the Grade 8 – Manitoba Math Curriculum - Strand: Statistics and Probability (Data Analysis and Chance and Certainty).
There are 162 activity sheets for your students to learn and practice the specific outcomes in the curriculum. Using this resource will ensure that your students will be learning the Manitoba curriculum. We have studied the curriculum so that you can focus on delivering the content as opposed to creating materials.
Some of the concepts that are covered:
- Comparing different types of graphs that display the same data to identify the strengths and weaknesses of different types of graphs
- Identifying the advantages and disadvantages of different types of graphs (bar graphs, circle graphs, pictographs, line graphs and double-bar graphs)
- Interpreting bar graphs, broken-line graphs, multiple-bar graphs, circles graphs and pictographs
- Creating a variety of graphs, including circle graphs and multiple-bar graphs
- Determining the mean, median, and mode of data sets
- Determining the impact of adding or removing outliers from a data set on the mean, median, and mode
- Finding the missing value in a data set using the mean
- Drawing conclusions about different sets of data
- Thinking critically about misleading graphs (bar graphs, circle graphs, pictographs, line graphs and double-bar graphs)
- Creating misleading graphs by using different scales and line breaks
- Using fractions, decimals, and percents to represent the probability of multiple independent events
- Understanding the difference between theoretical and experimental probability
- Comparing theoretical and experimental probabilities of independent events
- Using tree diagrams to represent independent events
- Use Venn diagrams to represent probabilities and help solve probability problems
Google Lesson Slides
Grade 8 - Statistics Unit, Manitoba Math, Google Lesson Slides! This resource is packed with all the lessons you need to teach the Statistics, Grade 8, Manitoba Math Curriculum.
We have structured these lessons to follow the popular 3-Part Lesson format. By using these lessons, you will be provided with learning goals, discussion questions, relevant YouTube videos, interactive slides, exit cards, and more. Check out the variety of activities you'll receive below.
Part 1: Minds On!
- Learning Goals
- Discussion Questions
- Polls/Surveys
- Picture Prompts
- Jokes and Riddles
- Relevant Quotes
Part 2: Action!
- Interactive Activities
- Drag and Drop
- Fill in the Blanks
- Matching
- Sorting
- Polls/Surveys and Graphing
- Embedded YouTube Videos
Part 3: Consolidation
- Exit Cards
- 3-2-1 Reflections
- One Word Reflections
- Act It Out!
- Quick Draw
- One Sentence Summary
After purchasing this resource, you will be able to download a copy of this file to your Google Drive. From there, you can complete these lessons with your class, and/or assign these slides in Google Classroom.